Case Study
Encore
Hotel Financial Management Platform
Duration
8 months
Platform
Web & Mobile
Role
UX Designer
Overview
Replacing spreadsheets with clarity
Encore is a financial management platform built for multi-property hotel groups. It replaces disconnected spreadsheets with a centralized system for budgeting, expense tracking, approvals, and analytics - serving four distinct user roles from admin teams to vice presidents.
Over 12 weeks, I designed the complete experience across desktop and mobile - from stakeholder research and information architecture through wireframes, visual design, and interactive prototypes. The platform launched to 20+ hotels.
The Problem
Hotel managers were drowning in spreadsheets. Financial planning happened across disconnected Excel files, making it nearly impossible to maintain centralized visibility into budgets, expenses, and forecasts.
Without real-time analytics or a unified system, financial oversight was reactive rather than strategic. Budget decisions were delayed, approvals got lost in email threads, and vendor coordination suffered.
Before
- Spreadsheet-based budgeting
- No centralized visibility
- Difficult data retrieval
- Manual report generation
After
- Centralized platform
- Real-time data visibility
- Instant historical access
- Automated analytics
Research & Discovery
Four distinct user roles
The platform needed to serve multiple roles across the hotel management hierarchy, each with distinct responsibilities and decision-making needs.
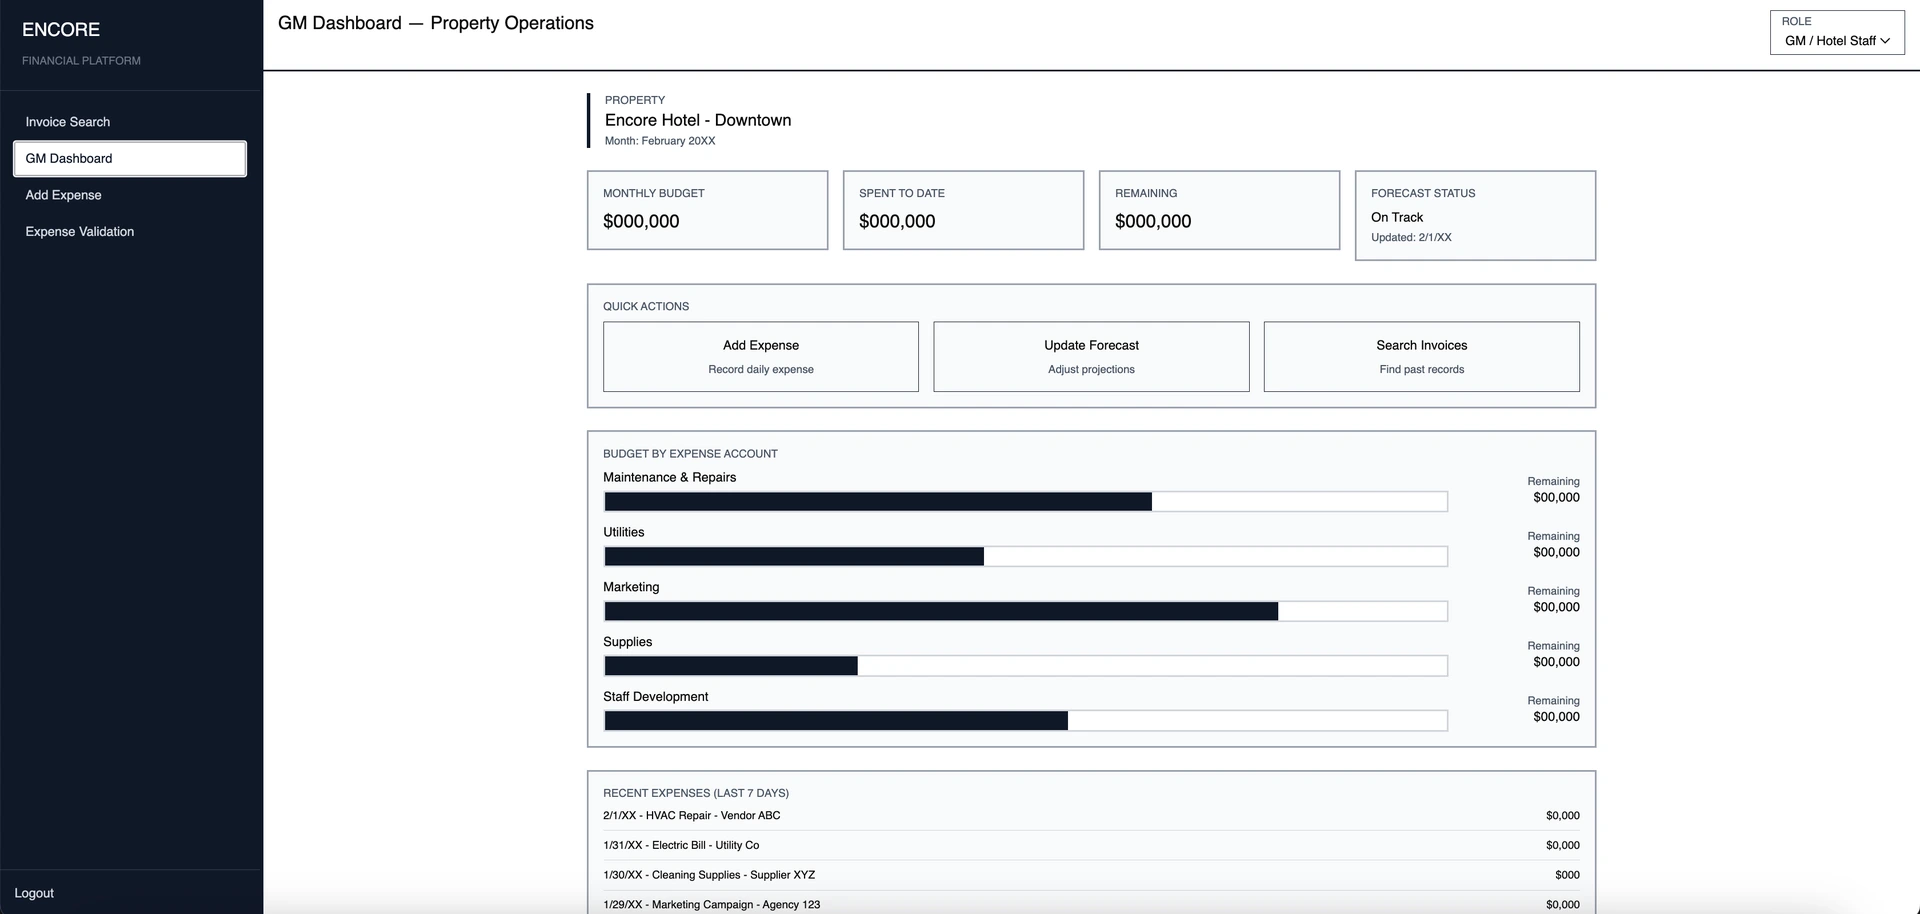
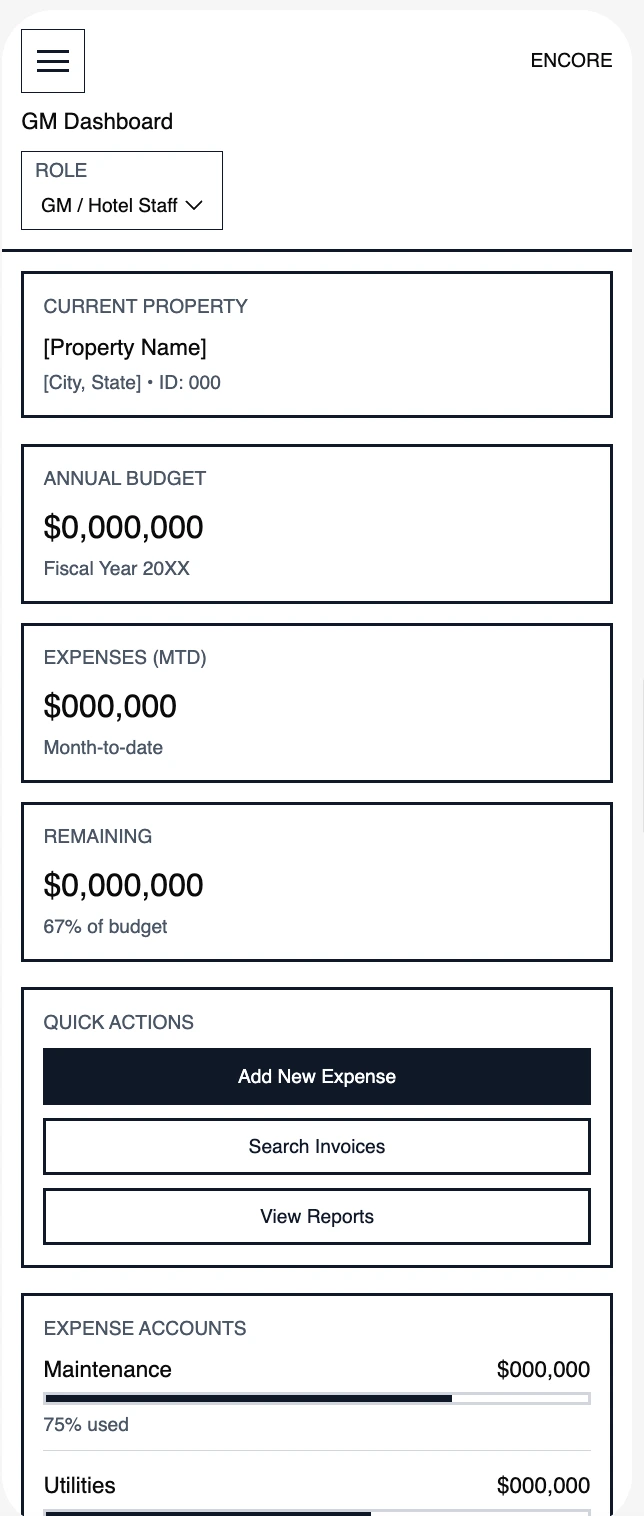
General Managers
Monitor budgets, approve expenses, track performance at property level
Regional Managers
Oversee properties, compare performance, spot trends across regions
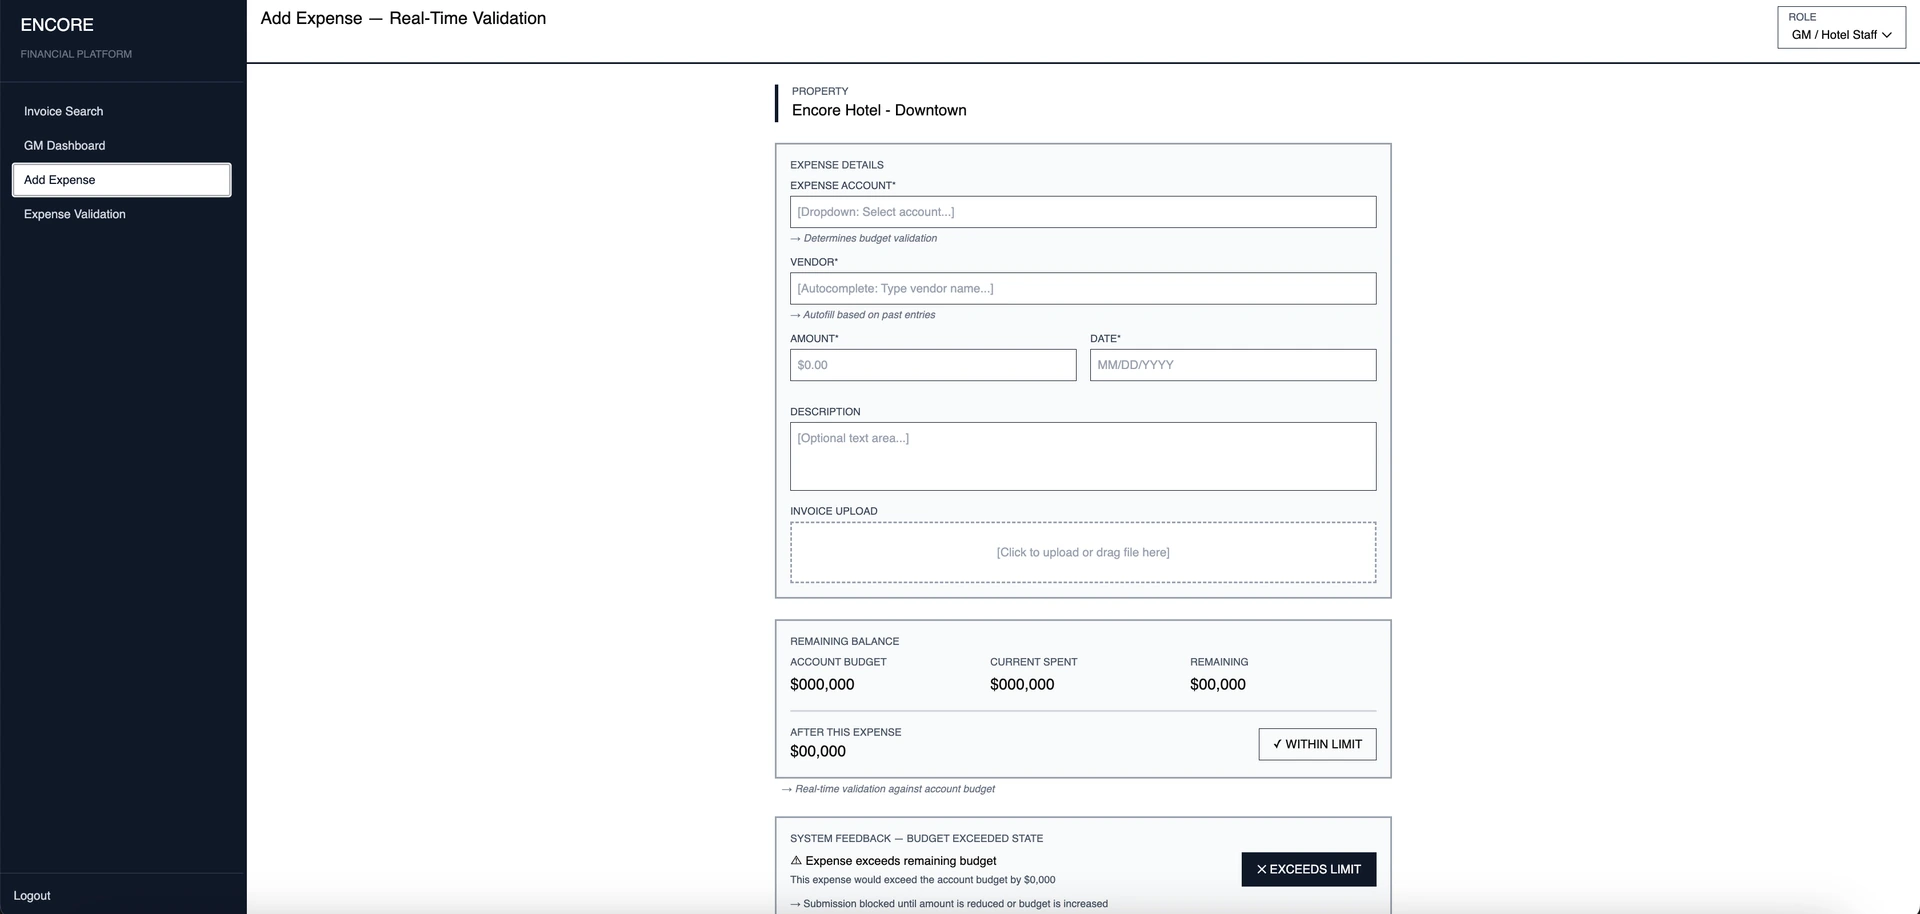
Admin Teams
Enter data accurately, submit expenses, coordinate vendors
Vice Presidents
Strategic planning, portfolio visibility, data-driven decisions
Defining the Experience
Key scenarios we designed for
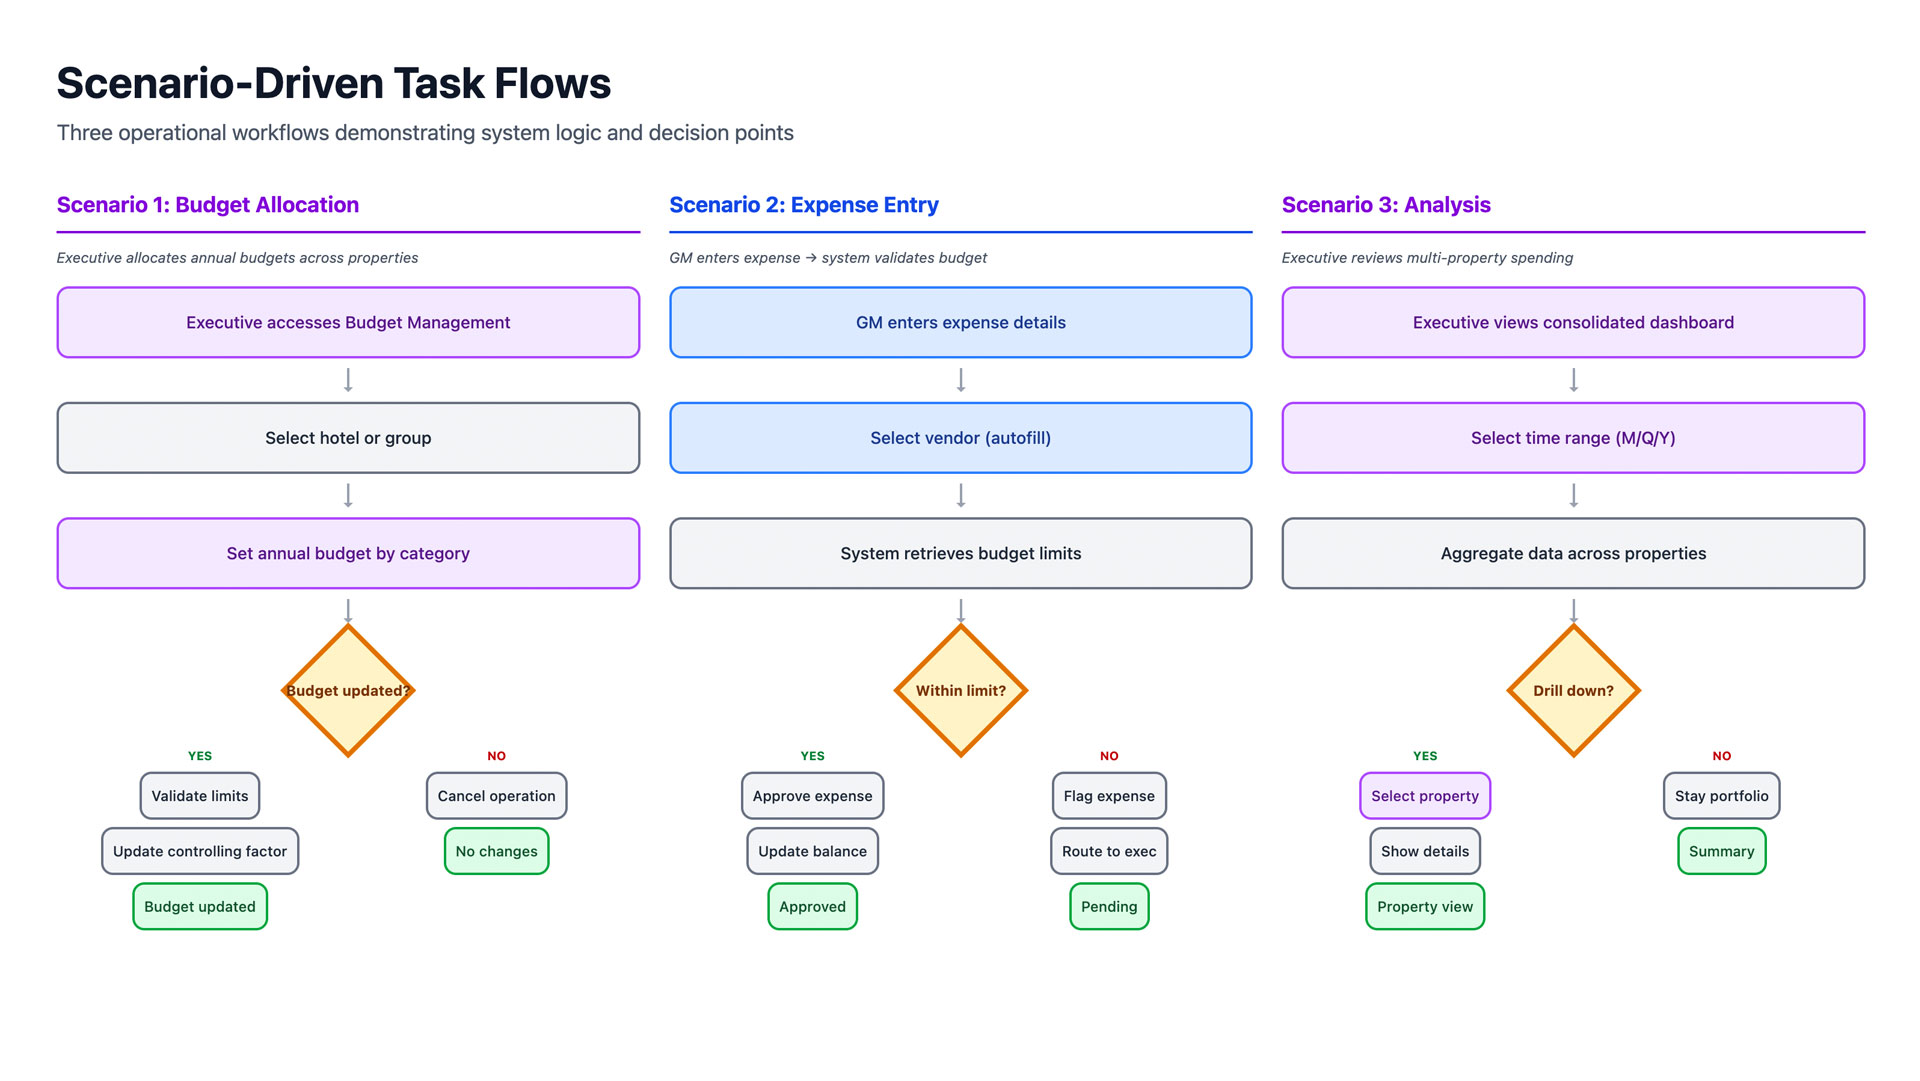
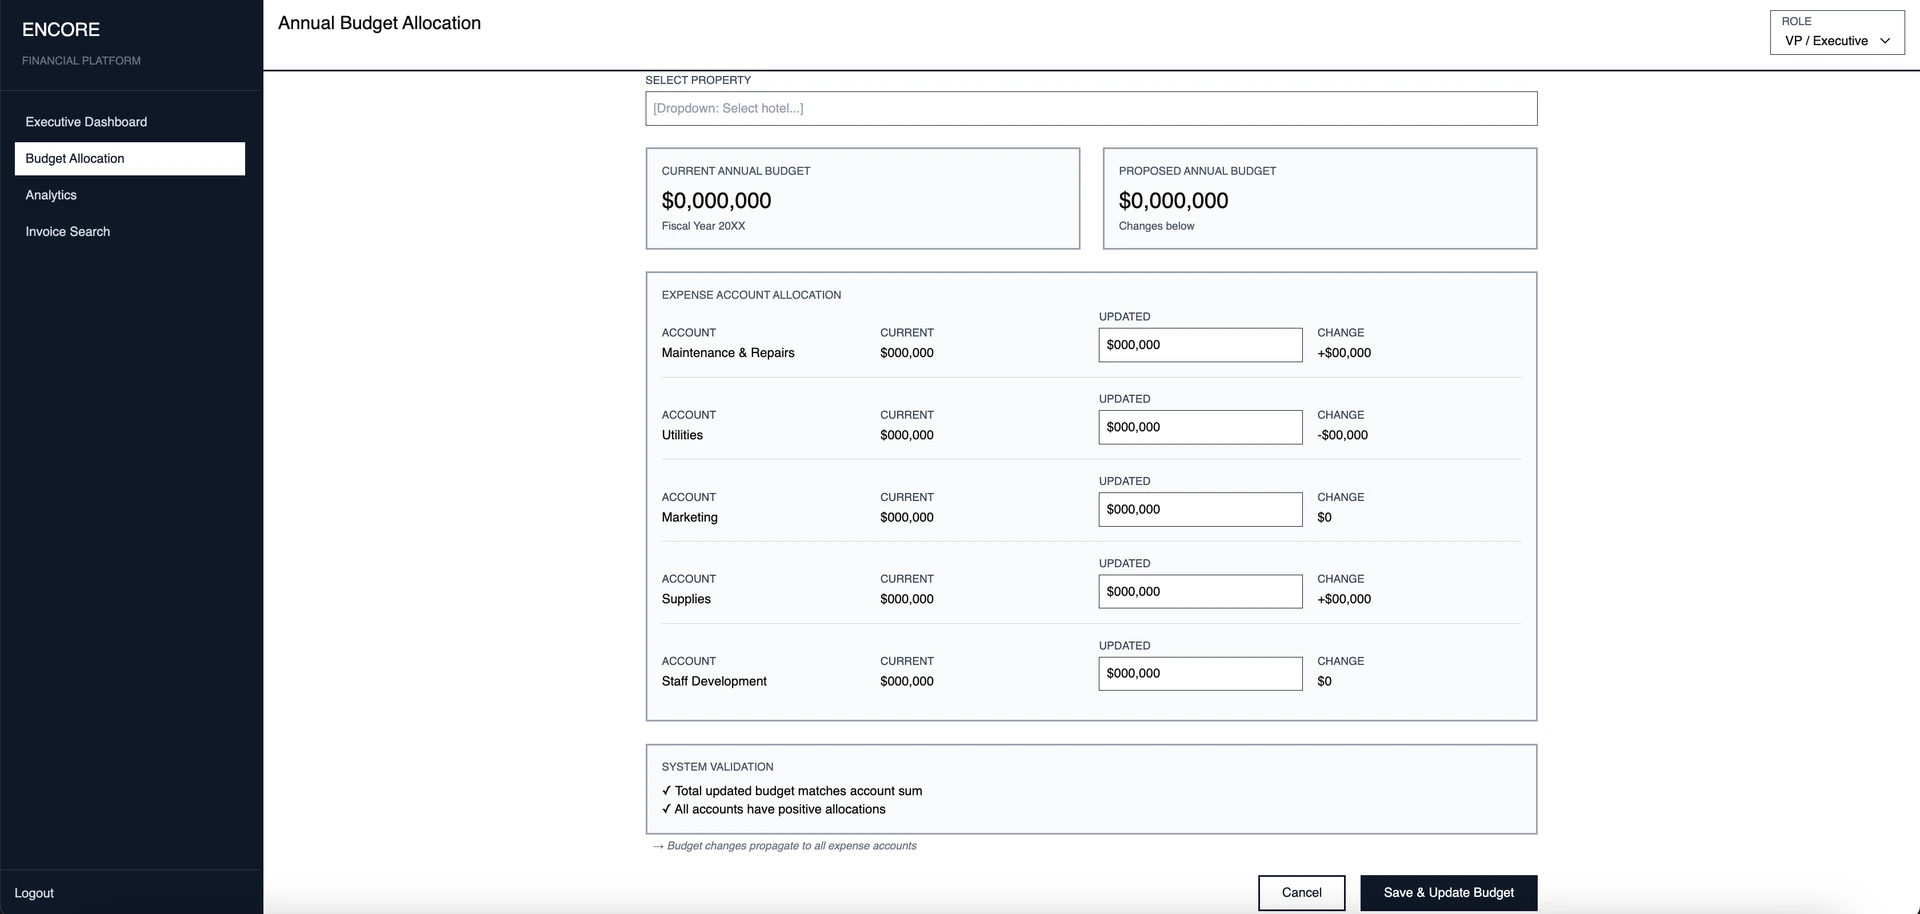
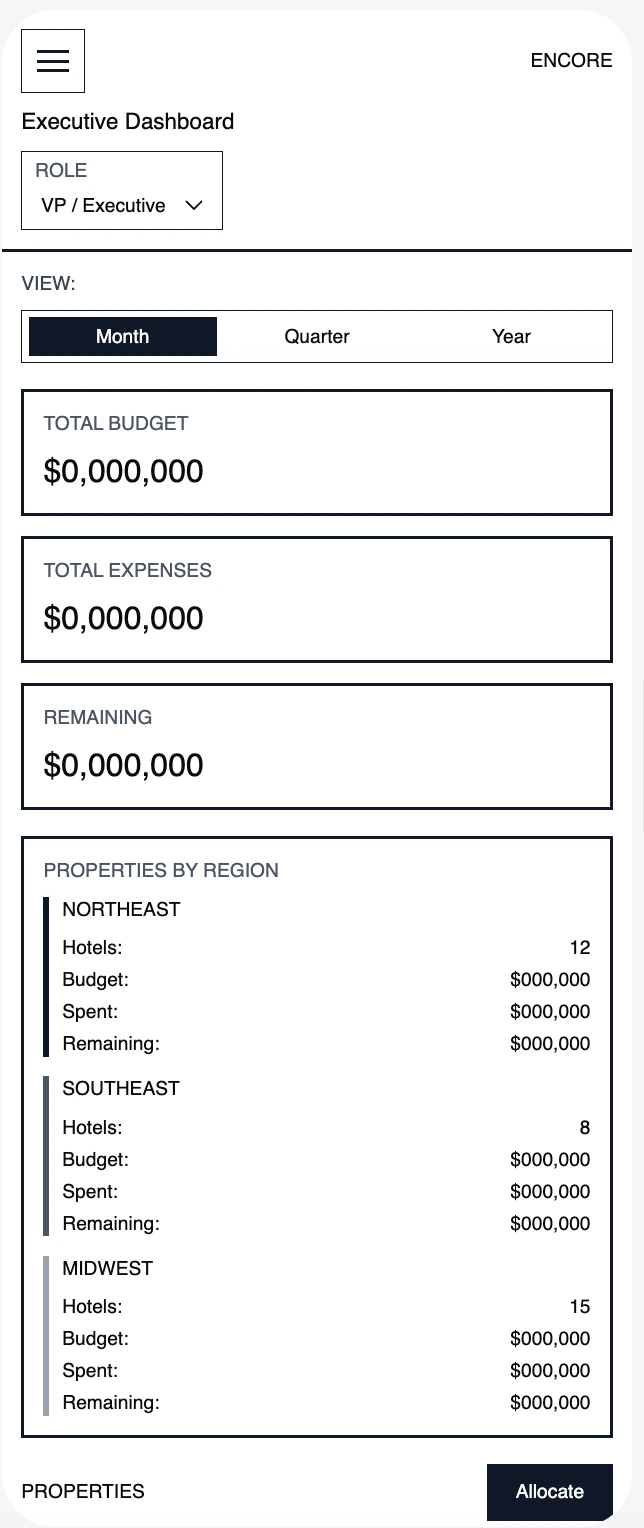
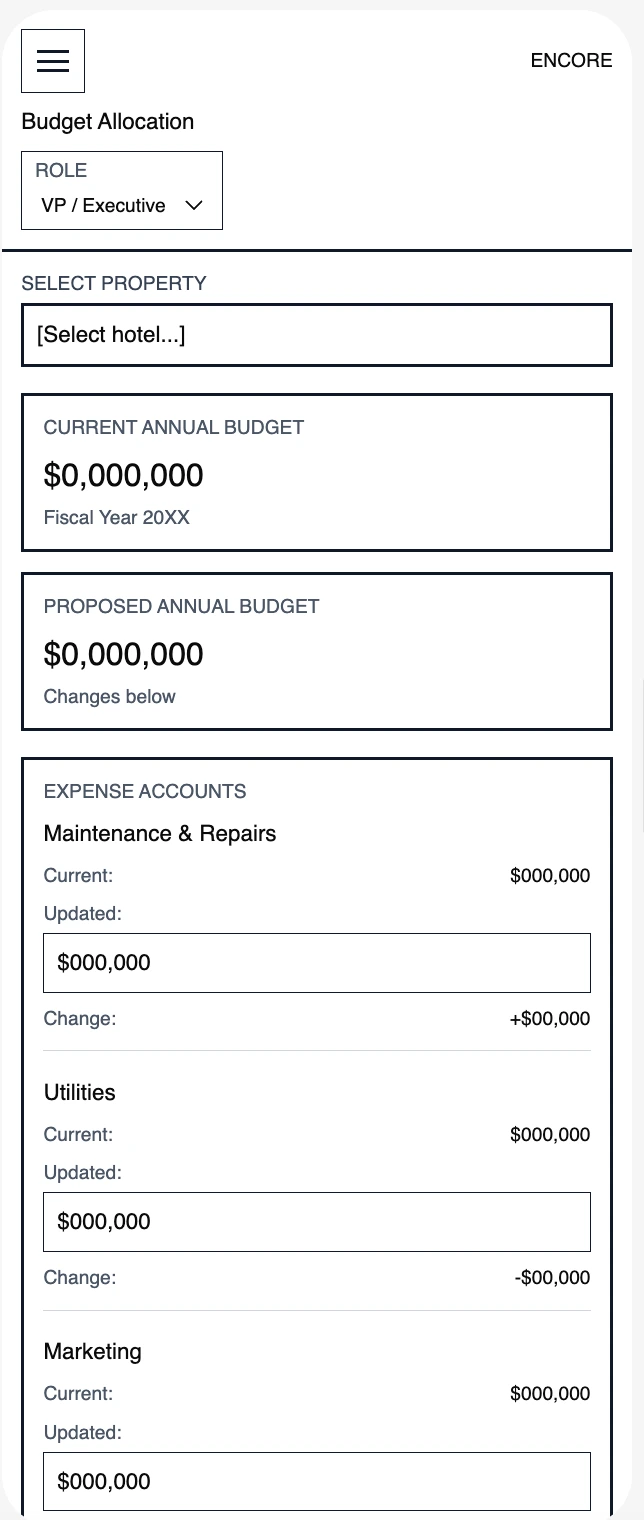
Budget Allocation
GMs allocate quarterly budgets across departments, view spending trends, and adjust allocations based on seasonality and historical data.
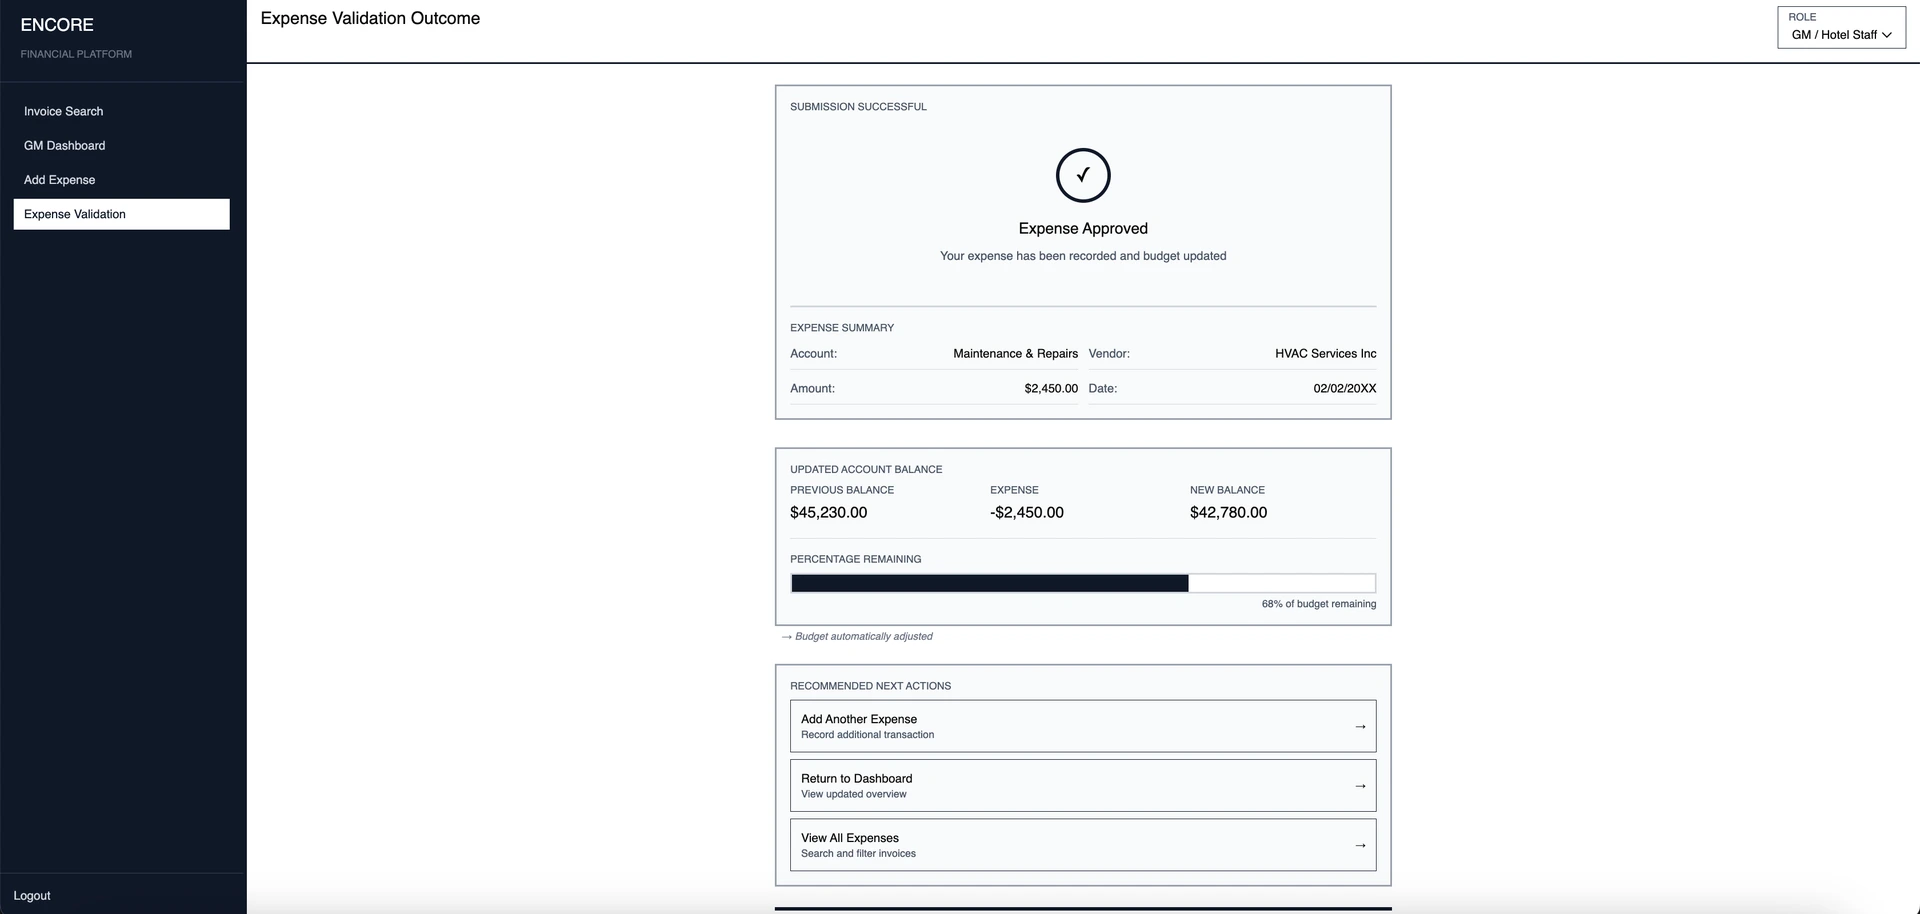
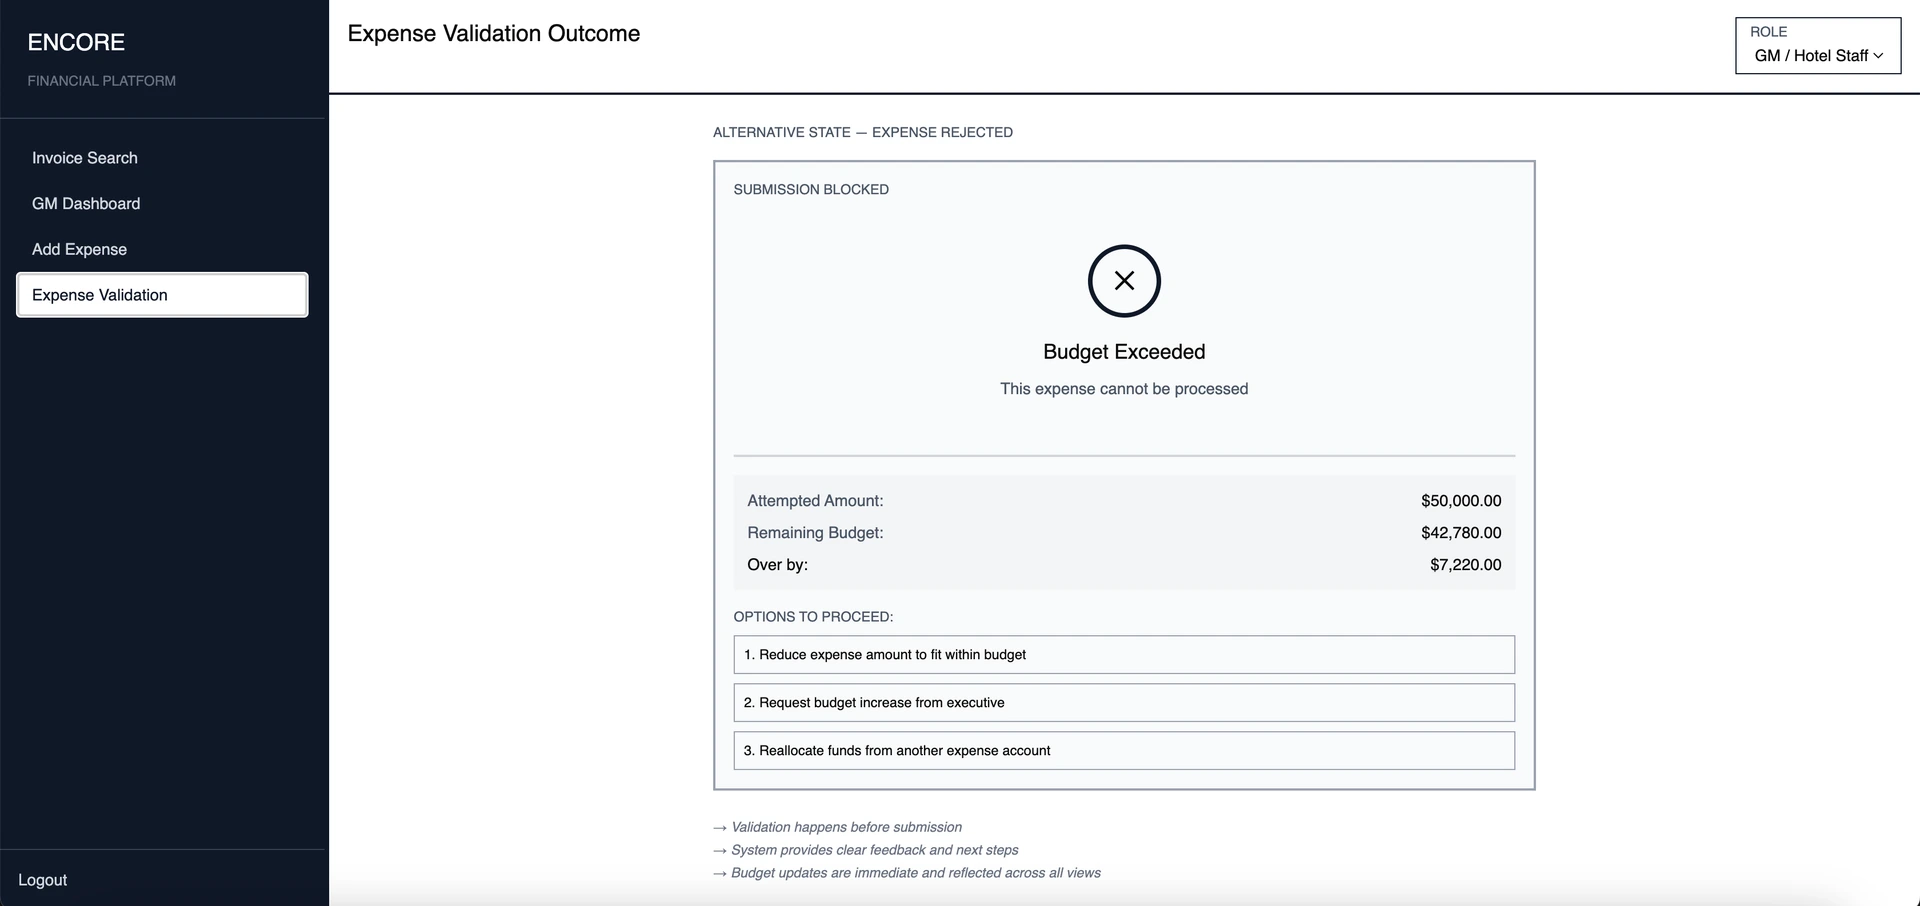
Expense Approvals
Approval workflows need to be visible, trackable, and fast - with mobile access for managers on the go.
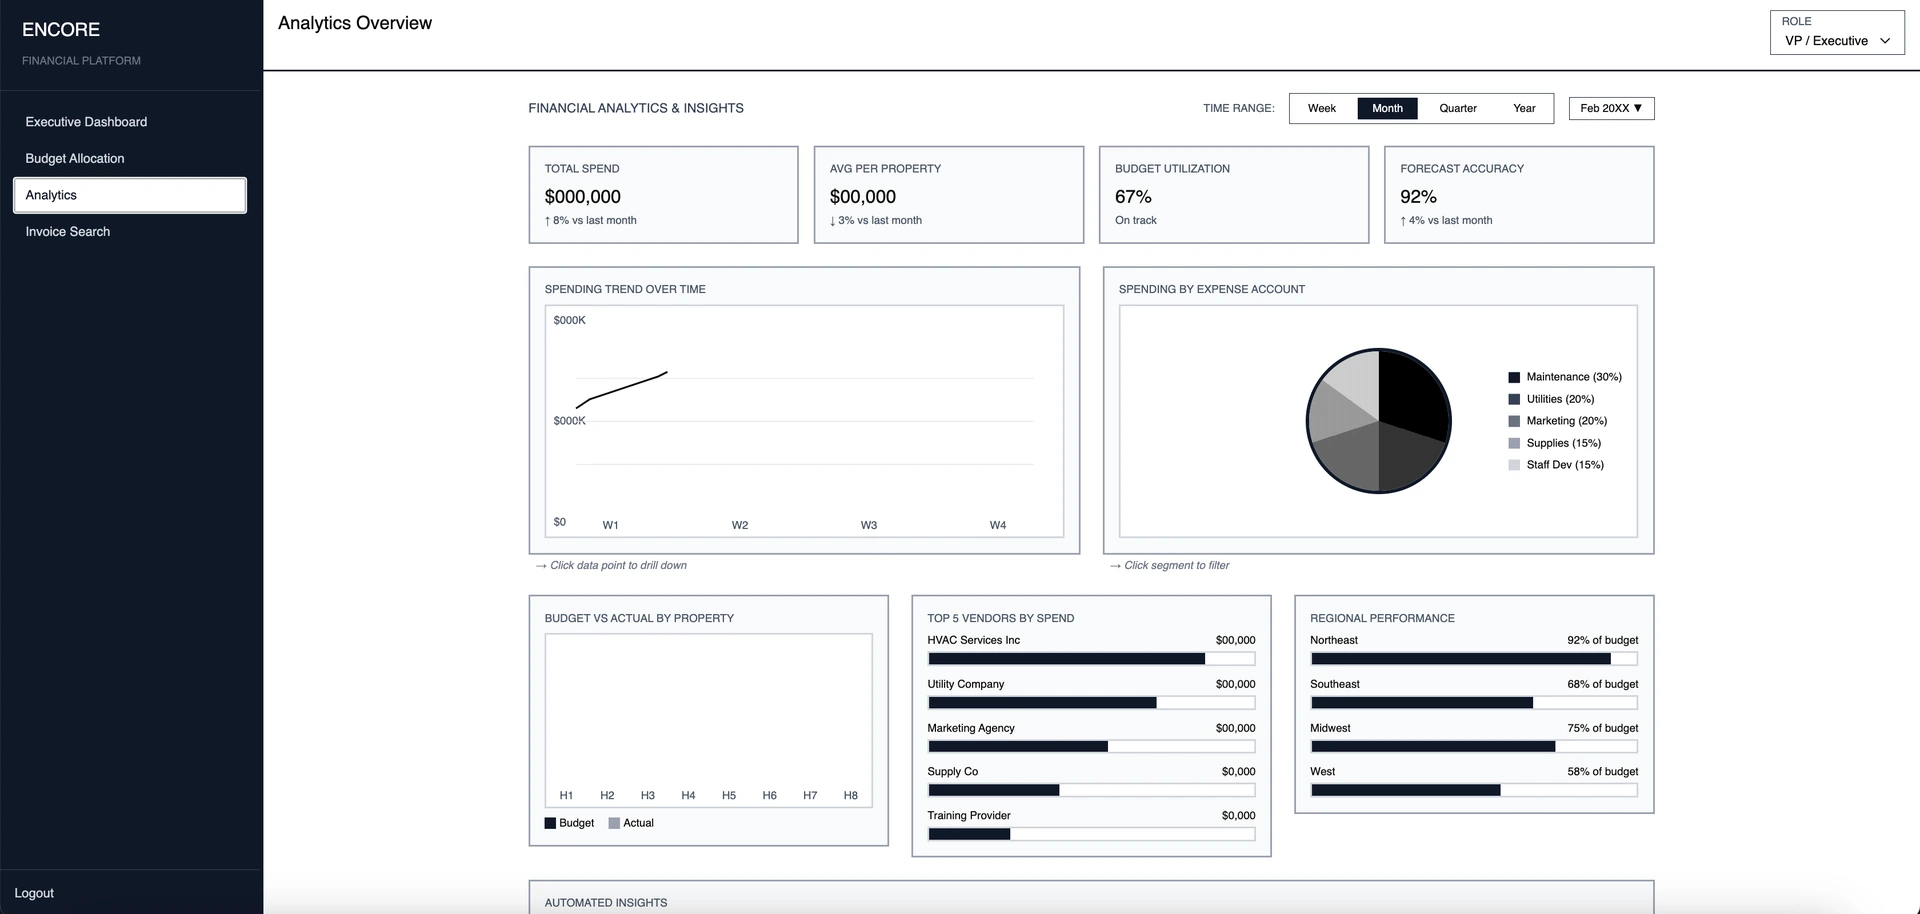
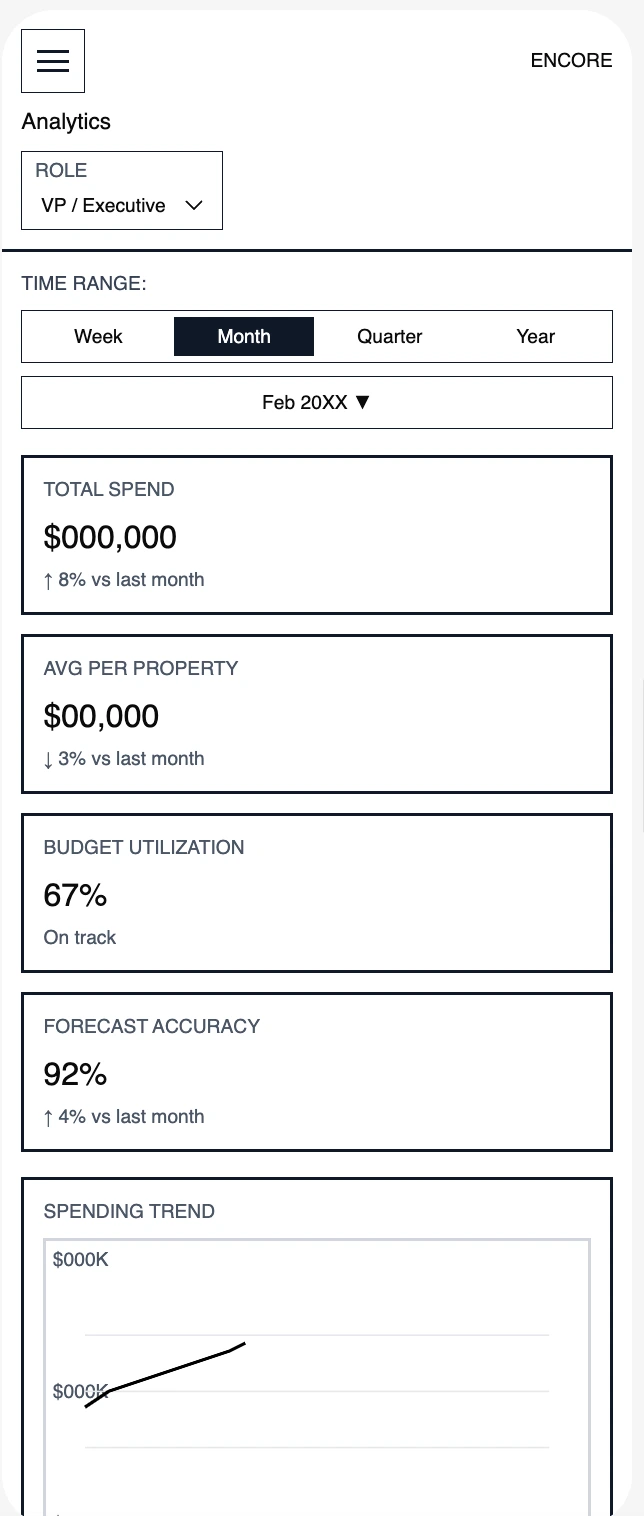
Monthly & Yearly Analysis
Regional and VP-level users need comparative dashboards with filtering by property, time period, and expense category.
Design Direction
UX design principles
Core principles shaping every interaction across the Encore platform.
Role-Based Views
Each role sees exactly what they need, nothing more
Progressive Disclosure
Surface summaries first, drill-down for detail
Mobile-First Approvals
Managers can approve expenses on the go
Data Density Balance
Rich data without visual overwhelm
Contextual Validation
Real-time budget checks prevent overages
Cross-Property Comparison
Side-by-side analytics for portfolio decisions
Information Architecture
Role-based navigation structure
Each user role accesses a tailored view of the platform, with shared components adapting to context.
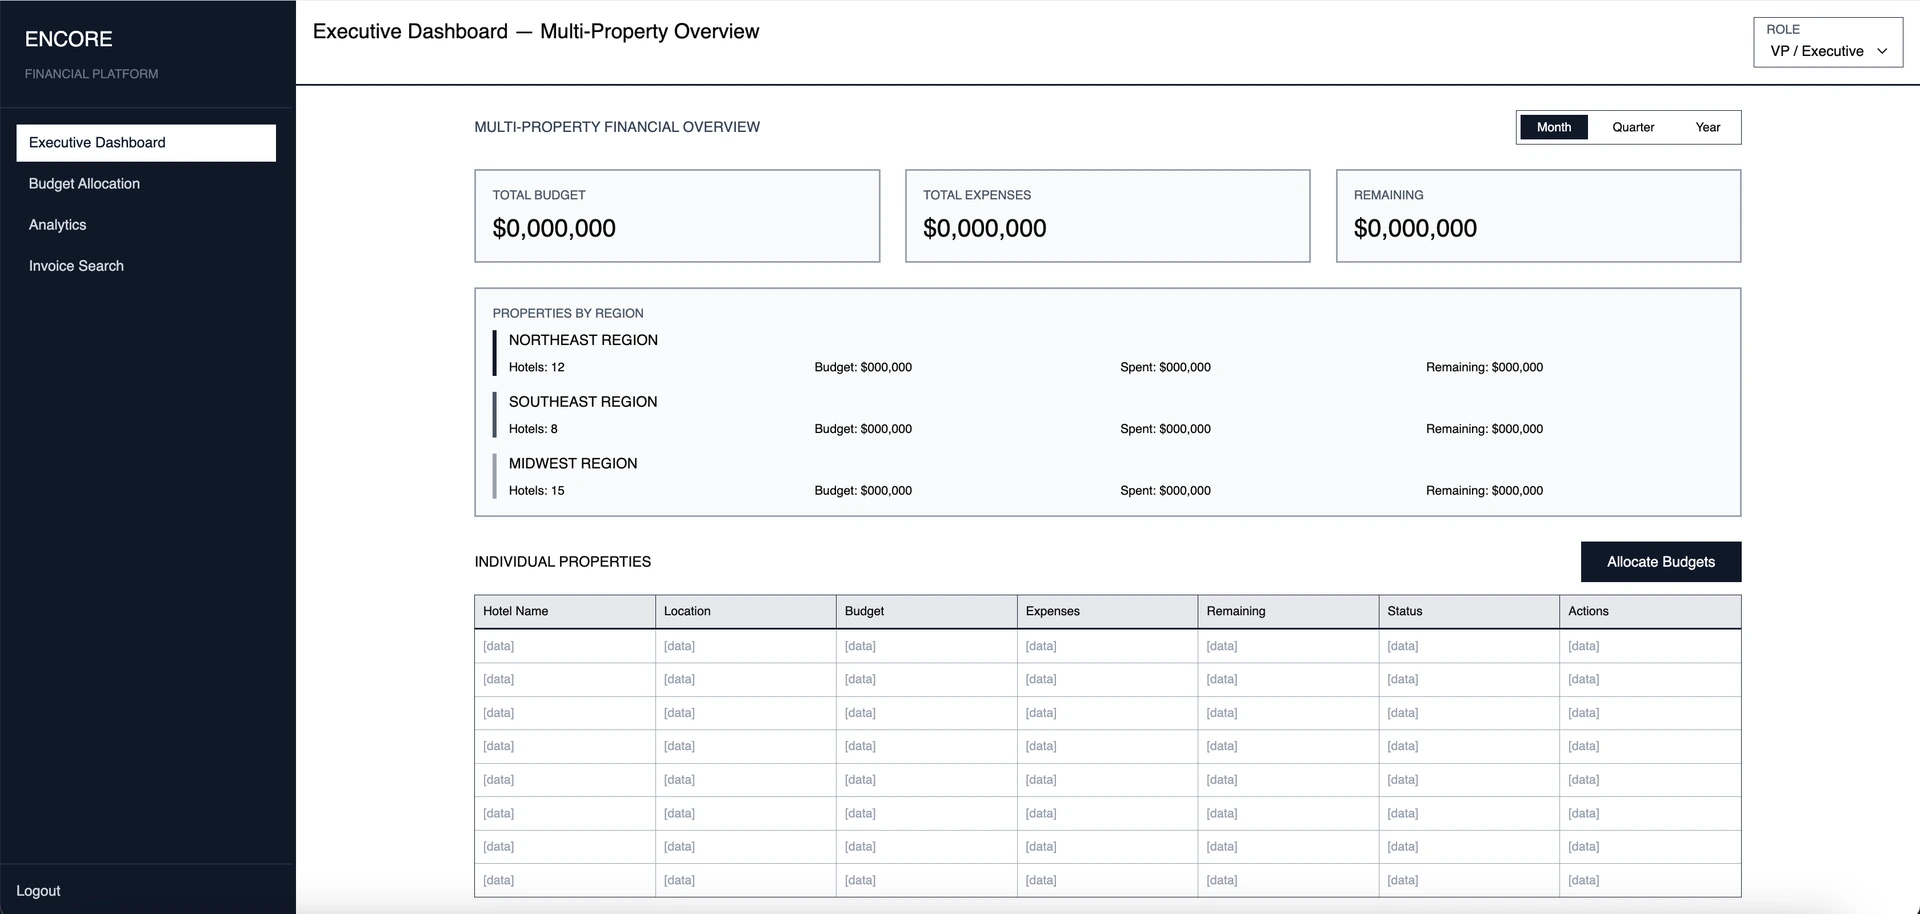
Executive View
Portfolio Dashboard
High-level KPIs → Property comparison → Drill-down analytics
GM View
Property Dashboard
Budget allocation → Expense approvals → Monthly reporting
Admin View
Data Entry Hub
Add expenses → Upload invoices → Submit for approval
Regional View
Multi-Property Analytics
Cross-property comparison → Trend analysis → Export reports
Wireframes
Exploring structure first
Low-fidelity wireframes to quickly test structural concepts with stakeholders. Focused on dashboard hierarchy, navigation patterns, and data density.
Desktop Screens
Executive Dashboard
01 / 08
Mobile Screens
Executive Dashboard
Budget Allocation
Analytics
GM Dashboard
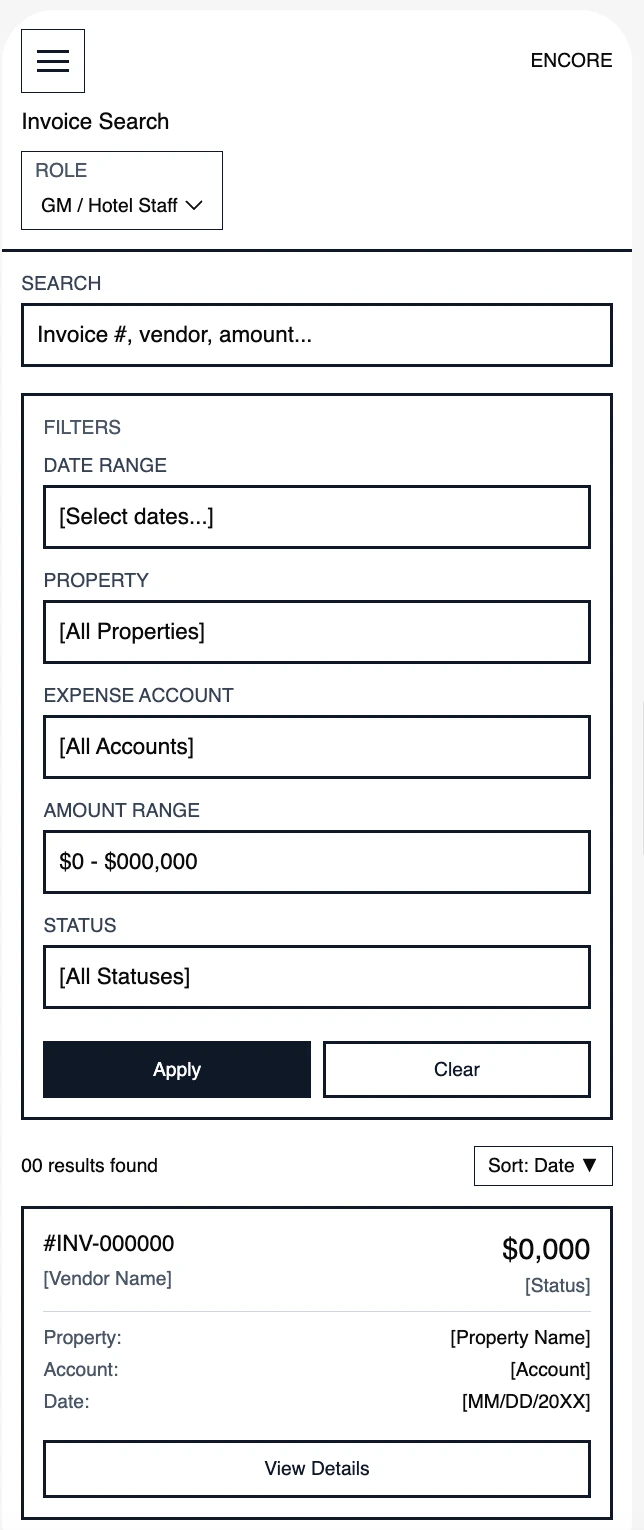
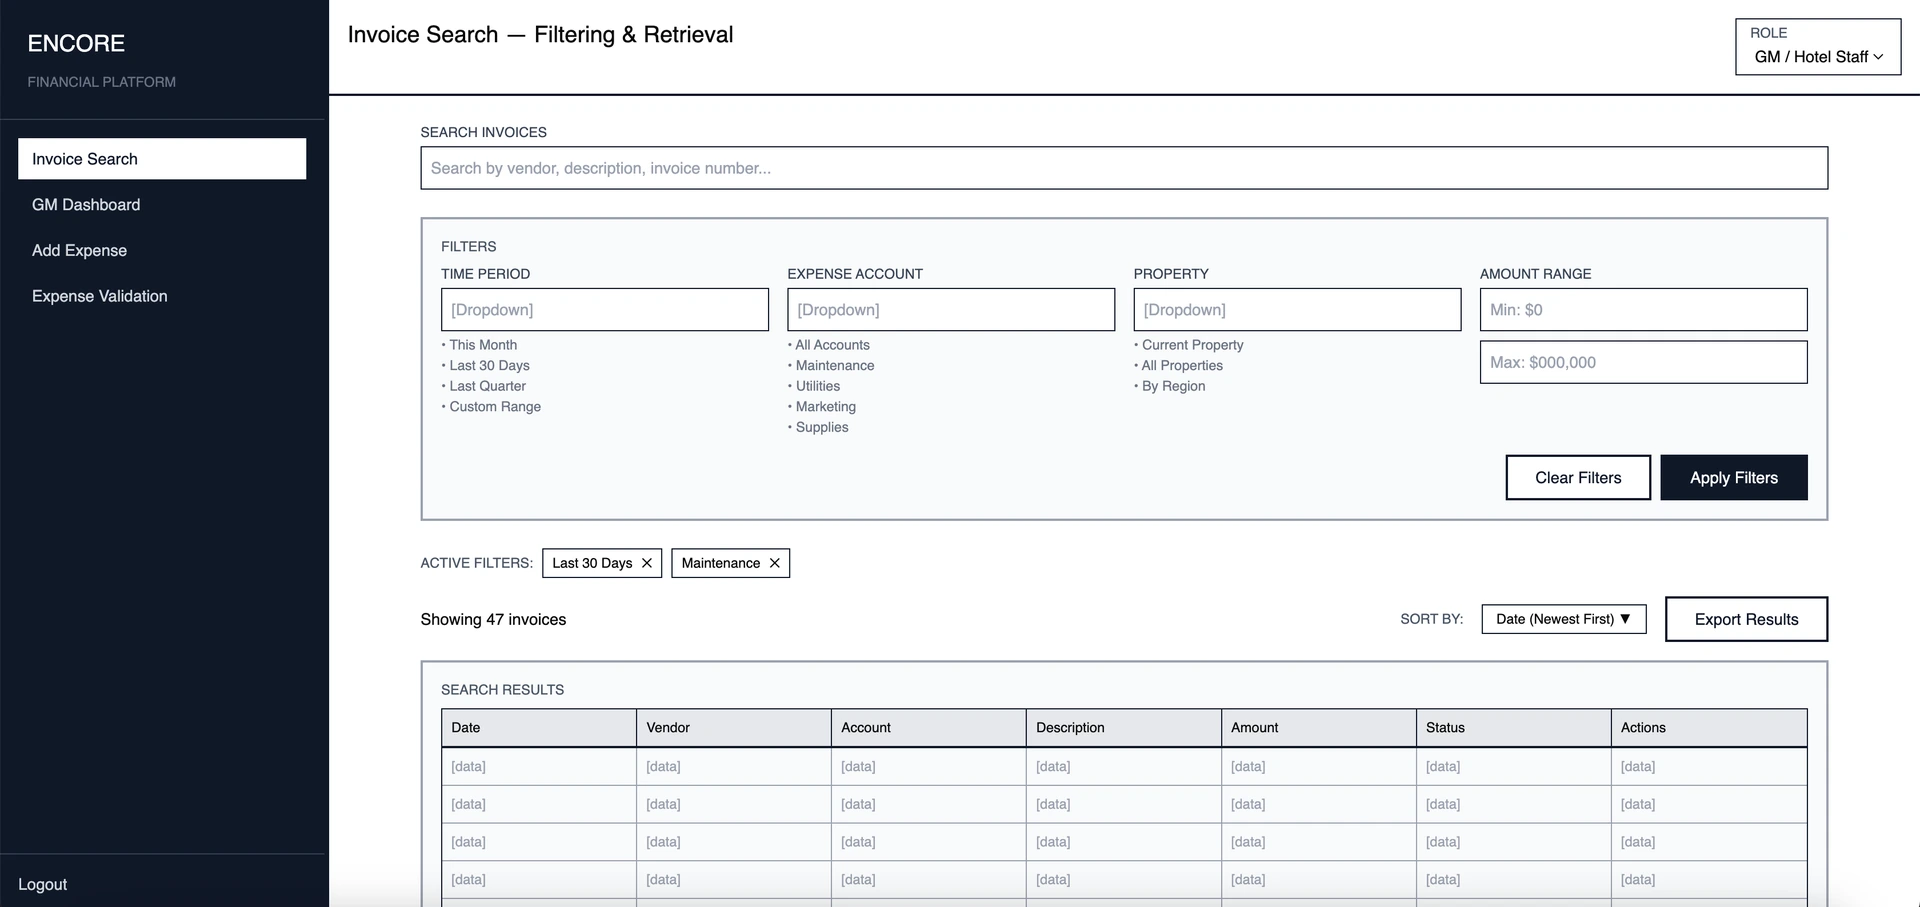
Invoice Search
Visual Design System
Design system & visual language
A consistent design language across desktop and mobile, optimized for dense financial data.
Design Tokens
#1a1a2e
Dark Background
#0656f6
Primary Action
#22c55e
Positive / Income
#ef4444
Alert / Over Budget
Data-Dense but Clean
Tables, charts, and KPIs use consistent spacing and hierarchy to stay scannable at any density.
Color as Communication
Green = on track, red = over budget, blue = action needed. Semantic colors reduce cognitive load.
Responsive Dashboard Grid
Desktop shows full analytics; mobile prioritizes approvals and KPIs with swipe navigation.
High-Fidelity Design
The final product
Role-specific dashboards that surface the most relevant information first, with progressive disclosure for deeper analysis.
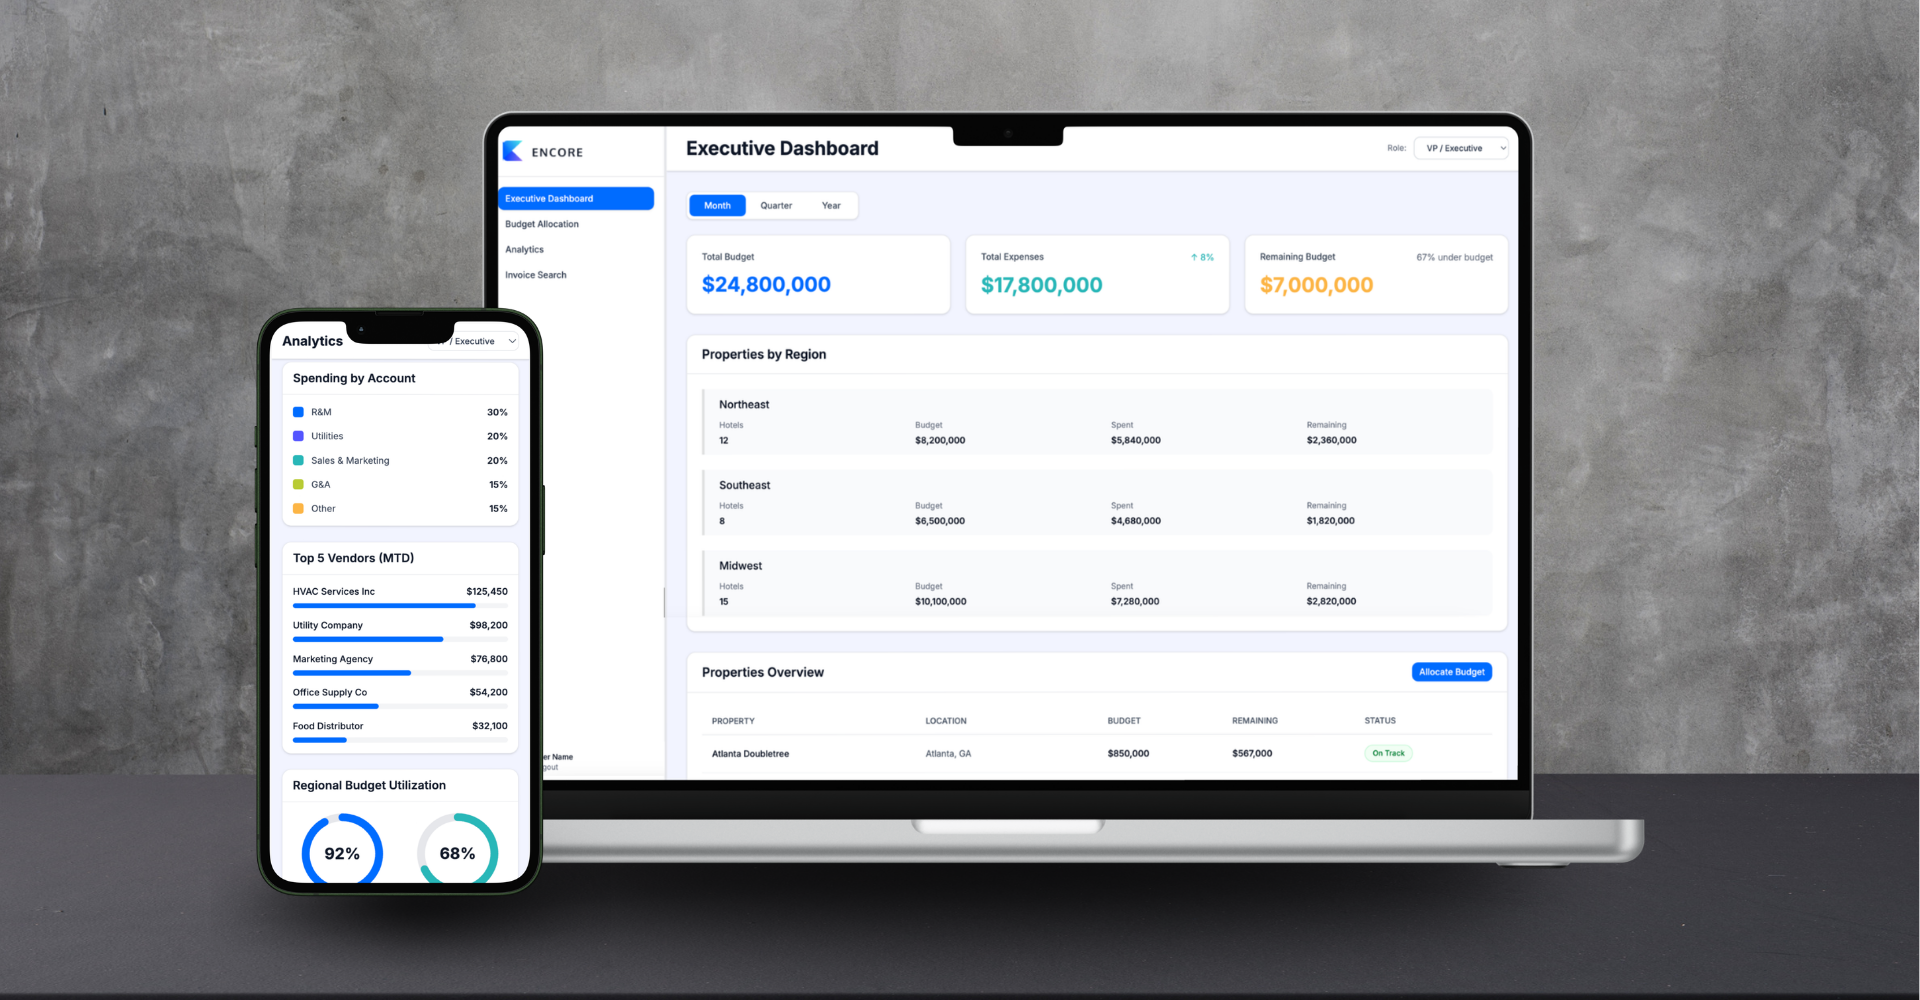
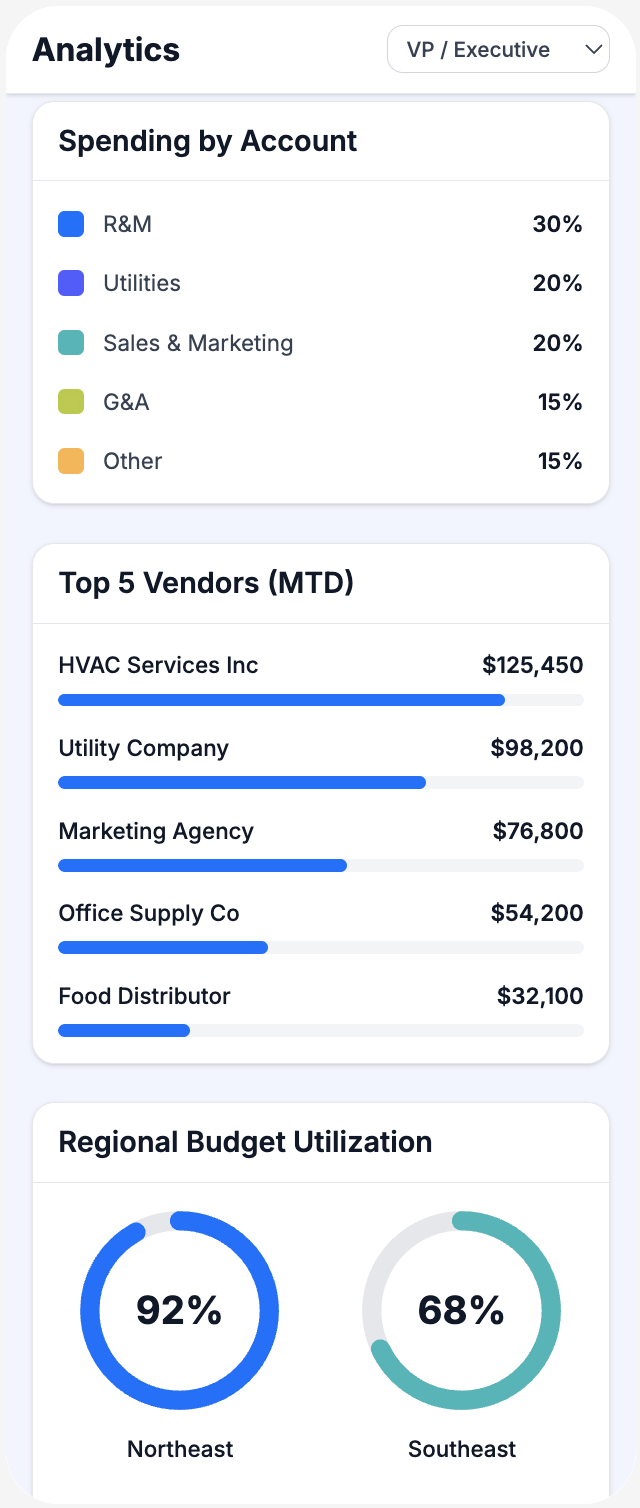
Multi-Property Financial Oversight
High-level financial monitoring and budget allocation across multiple properties.
Daily Financial Operations & Expense Management
Daily forecasting, expense management, and real-time financial insights.
Mobile - High-Fidelity Screens
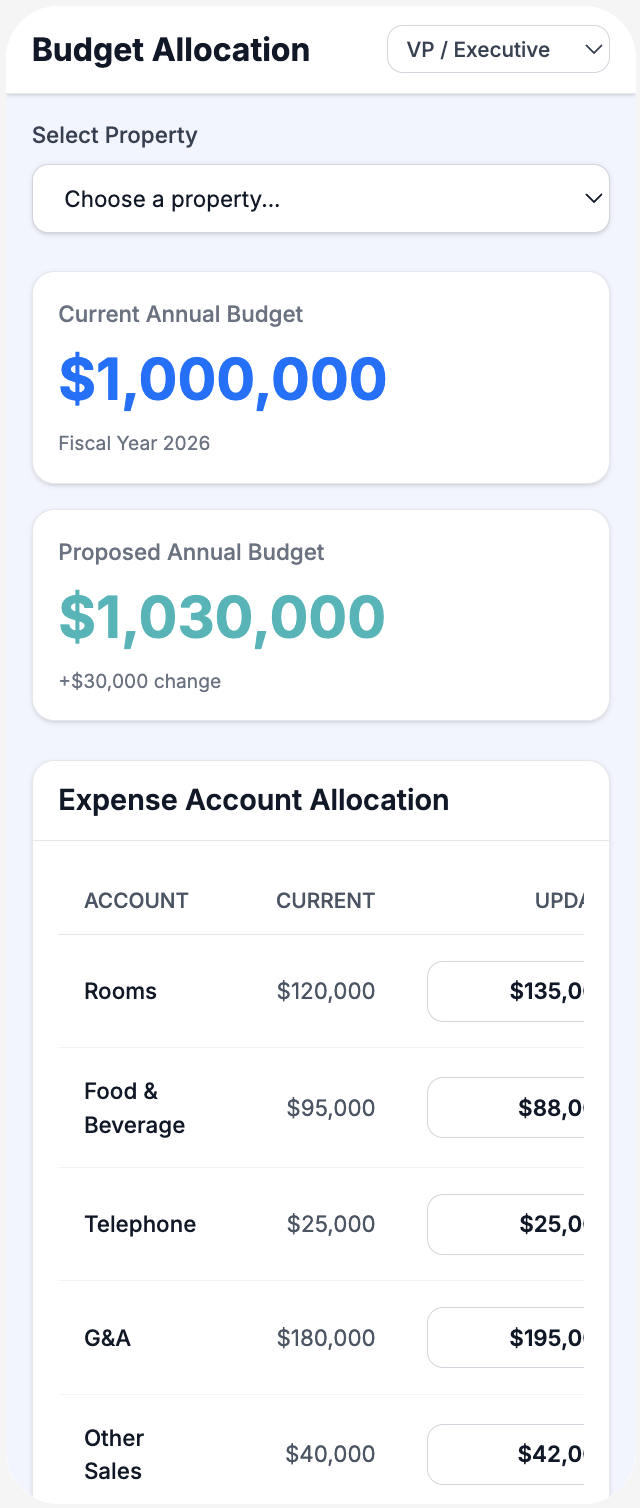
Budget Allocation
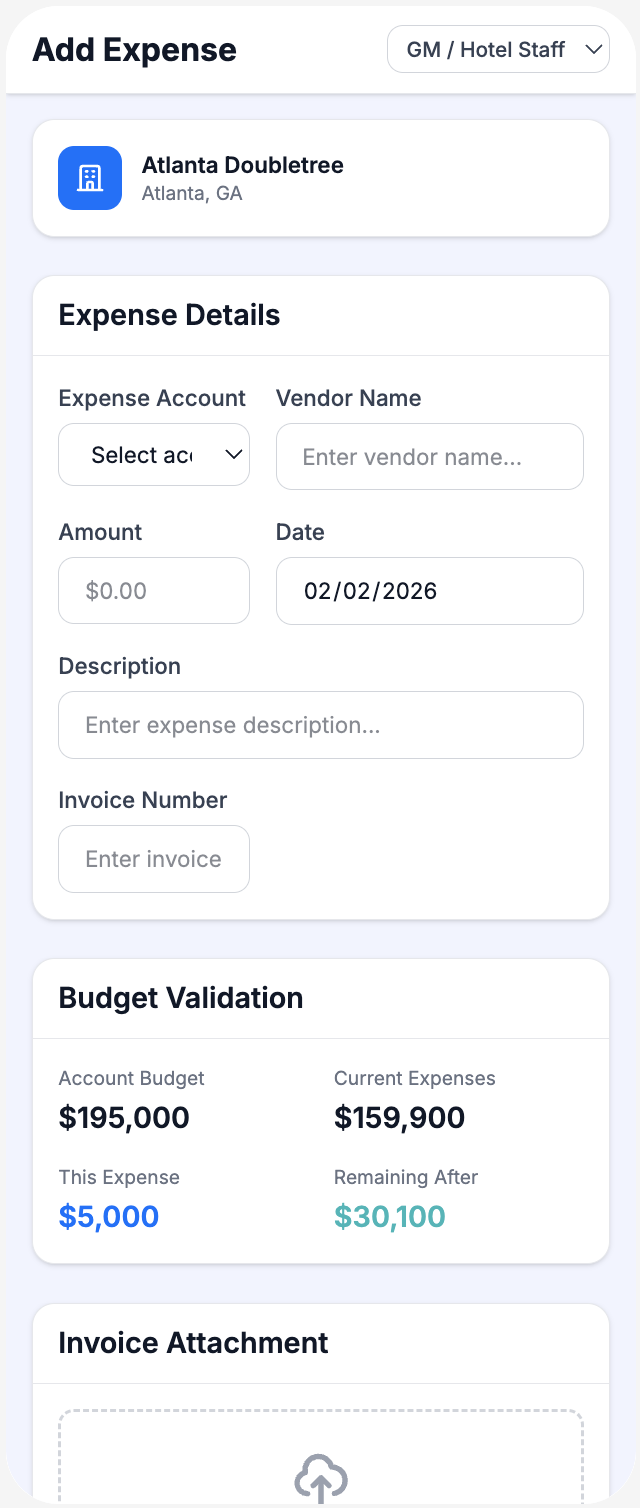
Add Expense
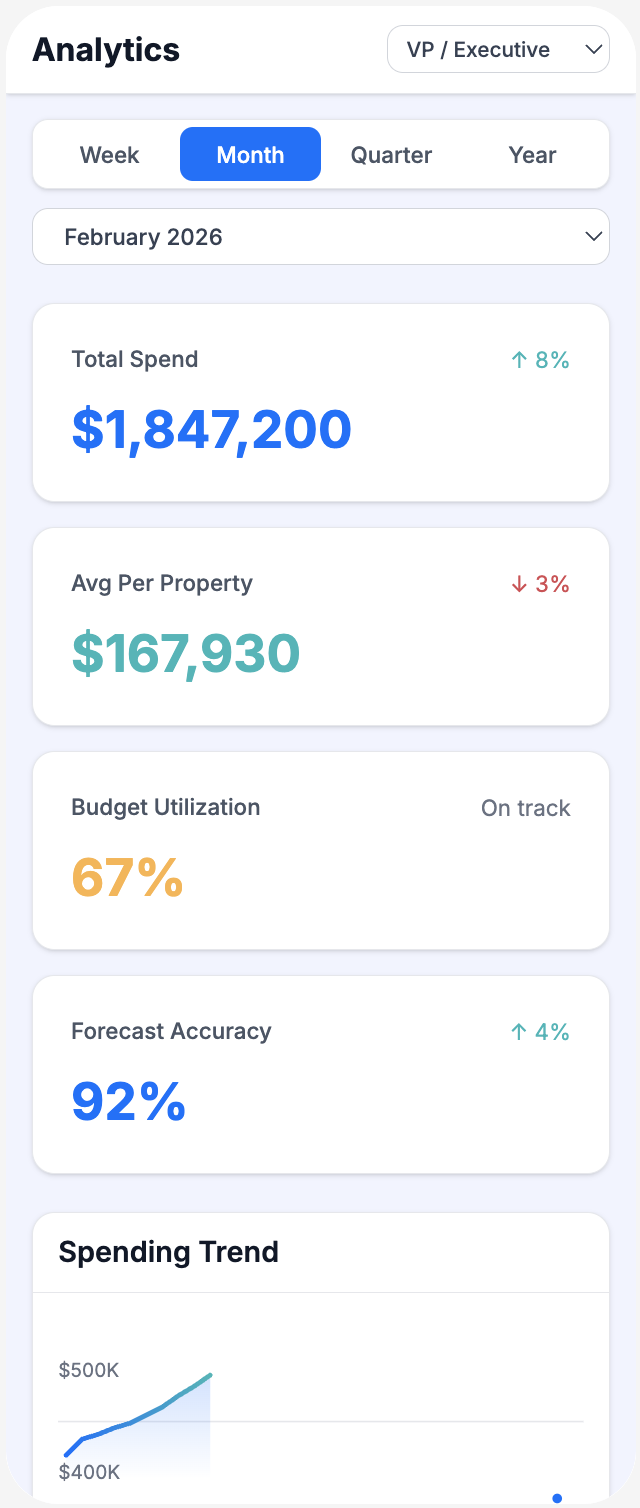
Analytics
Analytics Detail
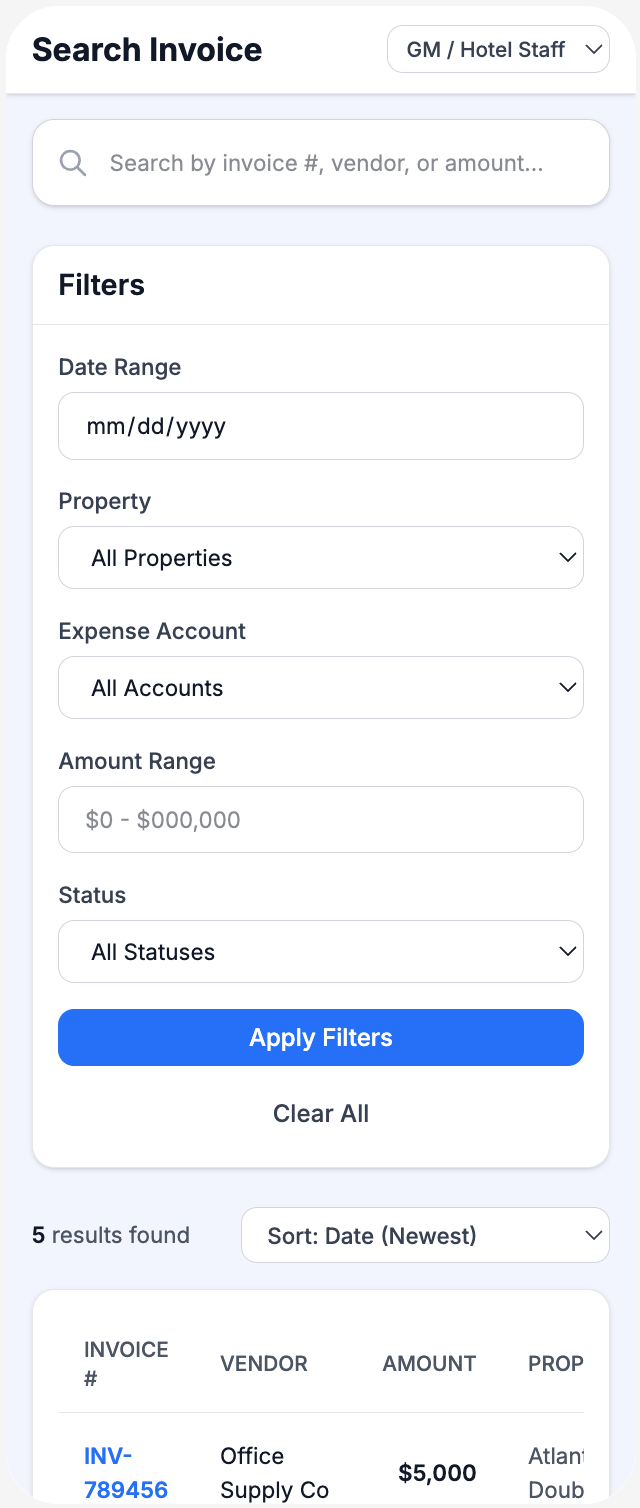
Invoice Search
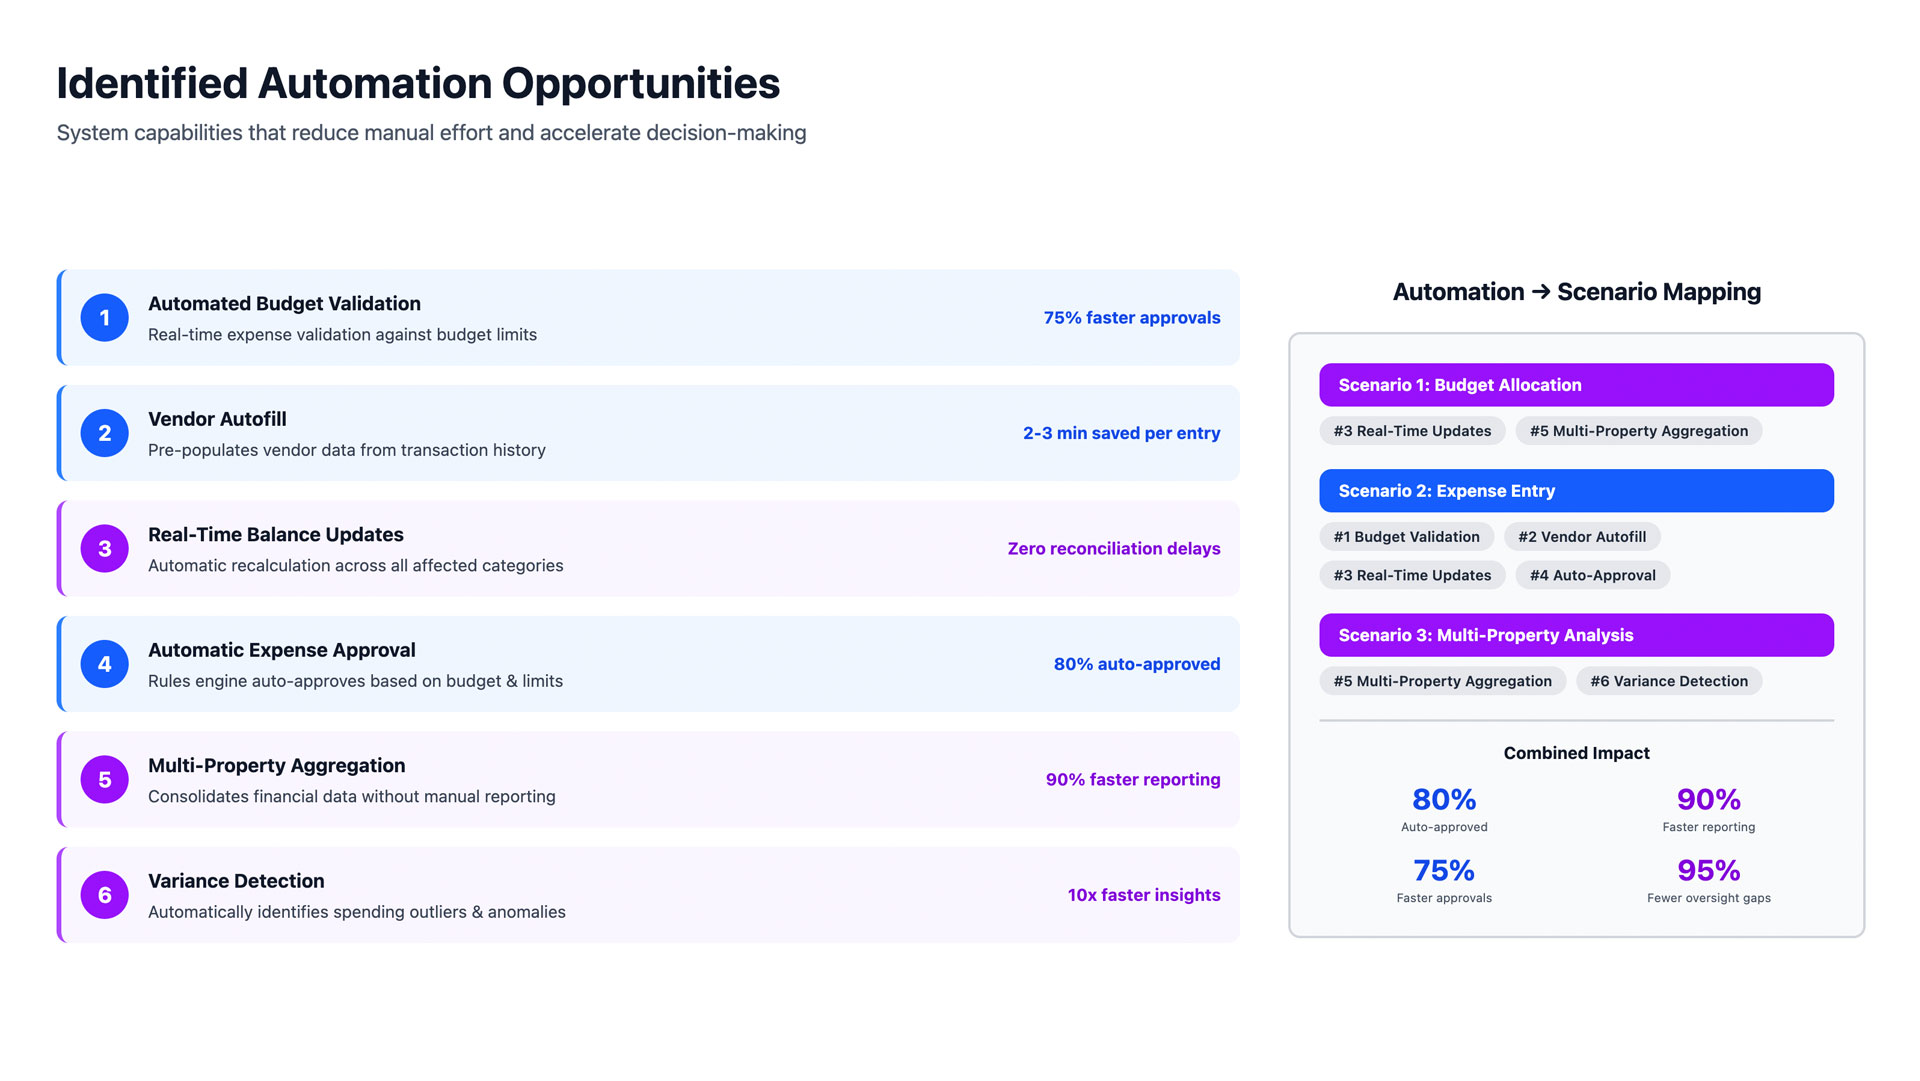
Outcome & Impact
Measurable results
The platform launched to 20+ hotels and delivered measurable improvements in financial management efficiency.
26%
Reduction in major expenses
Better visibility & approval processes
Real-time
Centralized data visibility
Across all properties
3x
Faster expense approvals
Days reduced to hours
Budget allocation efficiency
General managers complete quarterly budget allocation in half the time, with better visibility into historical spending patterns.
Approval speed
Mobile access to approval workflows reduced response times from days to hours, improving vendor relationships.
Data-driven decisions
Regional and VP-level users gained access to comparative analytics for proactive financial planning.
Reflection
This project reinforced the importance of designing for multiple user roles with fundamentally different needs. Balancing the complexity of enterprise financial data with the need for intuitive, fast workflows required constant iteration and stakeholder validation.
The biggest challenge was resisting the temptation to add features that sounded useful but didn't directly support core workflows. Staying focused on budget allocation, approvals, and analysis resulted in a platform that felt purposeful rather than overwhelming.